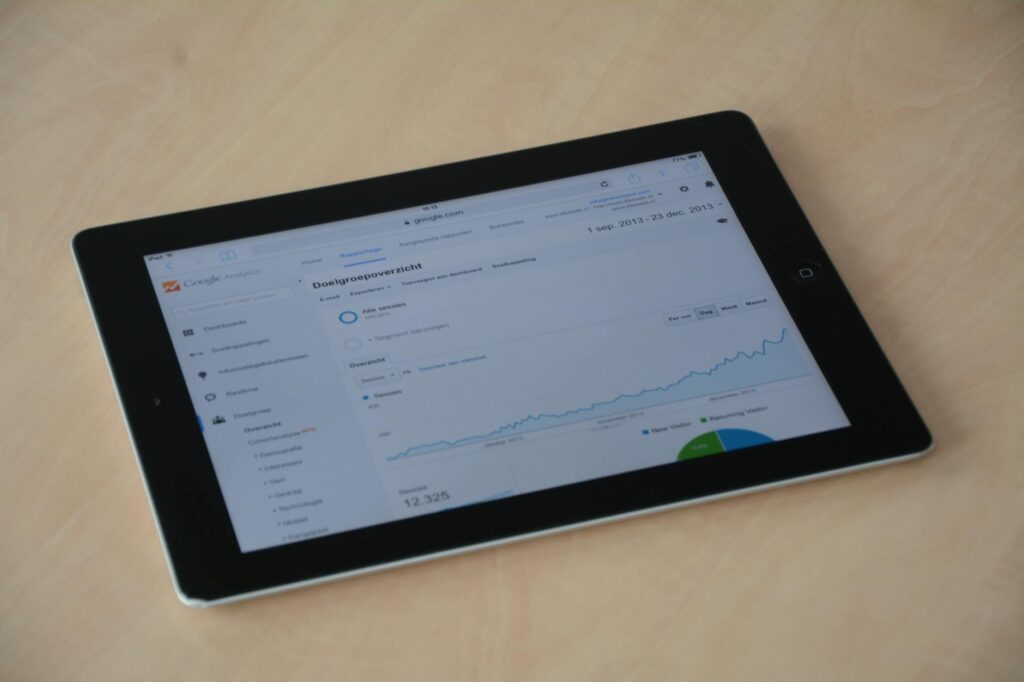
You open Google Analytics 4, see a dozen unfamiliar terms, charts with no explanation, and an “Explore” button you’re afraid to even click. A minute later you close the tab and go back to work. The numbers remain a mystery. The question of how to read a GA4 report comes up sooner or later for every business owner who’s been given access to analytics by an agency or freelancer and left to deal with it alone.
And as long as the reports go unread, the ad budget is spent blindly. You can’t see which channel actually brings in customers and which one is just “spinning” impressions with no results. Worse: an unguided attempt to make sense of the numbers, without understanding GA4’s logic, often ends not in confusion but in a wrong conclusion — the owner switches off a campaign that was actually working, simply because the report was misread.
In our experience, this is one of the most common reasons clients come in for an audit: they arrive saying “the ads aren’t working,” and the check reveals they are working — the report was just read the wrong way.
In this guide — no GTM setup, no technical detail — we’ll walk through 5 GA4 reports every business owner should check, and what each number means in the language of money, not the language of an analyst.
Where to Find the Reports You Need in GA4 (2-Minute Navigation)
The left-hand menu in GA4 has four main sections. For a weekly business check-up, you really only need one of them.
Home — a general dashboard with a somewhat arbitrary set of charts and cards. Looks informative, but the set of metrics shown isn’t fixed: one metric today, a different one tomorrow. Useful at best for a quick glance at “is anything happening on the site at all,” nothing more. Reports — the main section, and the place to start and end your weekly check: this is where Acquisition, Engagement, and Conversions live, in a consistent, predictable structure. Explore — a free-form report builder for non-standard questions like “how many users from organic search came back within a month and bought something.” A powerful tool, but it requires understanding dimensions and metrics, so it’s not needed for a basic weekly check. Advertising — attribution of ad campaigns across different models. Useful if you run ads across several channels at once, but it’s not the first report you should open.
To find what you need, go to Reports → Life cycle — Acquisition, Engagement, and Monetization are laid out there in sequence. It’s worth reviewing them in that exact order, because each report answers the question left open by the previous one: first where people came from, then what they did on the site, then whether it produced a result. If you’re opening GA4 for the first time, these three clicks replace the need to figure out the entire menu structure.
One more detail: at the top of every report there’s a date-range selector, set by default to “Last 28 days.” For a weekly check, it’s more useful to compare periods of equal length — say, “this week” versus “last week” — rather than looking at absolute numbers out of context.
The Acquisition Report — Where Your Customers Come From
This is the first report worth opening: it answers the most expensive question a business owner has — which advertising actually works.
There are two reports inside the Acquisition section, and confusing them is a common source of wrong conclusions. User acquisition shows where a user came from the very first time: if a customer arrived via organic search, then came back directly a week later and bought something, that entire user is “attributed” to organic search. Traffic acquisition, on the other hand, shows the source of each individual visit regardless of how the user arrived previously. For evaluating ad performance, this is usually the more useful one: it shows which channels are generating sessions and conversions right now, rather than the history of a person’s first encounter with the brand.
Every session in the table is labeled with a channel — Organic Search, Paid Search, Direct, Referral, Social. This is the so-called session default channel group: GA4 automatically classifies traffic based on a set of rules (UTM parameters, source domain, ad parameters) rather than asking you where the visitor came from. If a channel is misclassified, the most common cause is missing or broken UTM parameters on ad links.
For example (illustrative numbers, not real data):
| Channel | Sessions | Conversions | Conversion share |
| Paid Search | 1,240 | 18 | 1.5% |
| Organic Search | 410 | 22 | 5.4% |
| Direct | 305 | 6 | 2.0% |
| Referral | 90 | 3 | 3.3% |
In this example, Paid Search brings in three times as many sessions as Organic Search, but a nearly four-times-lower conversion share. That’s the kind of signal to reconsider your budget split — not automatic proof the channel is “underperforming,” just that paid traffic is currently converting worse than organic.
What does this mean for a business owner? If “Paid Search” generates a lot of sessions but few conversions, while “Organic Search” has few sessions but a high conversion share, that’s a signal to reconsider your budget split — not to automatically pump more impressions into the channel that already gets the most traffic.
The main channel categories that all further conclusions are built on:
- Organic Search — visits from unpaid search results (Google, Seznam, Bing)
- Paid Search — paid search advertising (Google Ads, Sklik)
- Paid Social / Organic Social — paid and unpaid visits from social media (Meta, LinkedIn)
- Direct — visits for which GA4 could not determine a source (more on this below)
- Referral — visits from other websites (partner content, press mentions, directories)
- Email — visits from email campaigns, provided the links carry UTM parameters
The practical takeaway is simple: compare channels not by the absolute number of sessions, but by the “sessions → conversions” ratio. A channel that brings fewer people but converts one in three of them is more valuable than one that brings three times as many visitors, of whom only one in a hundred buys.
Engagement Rate Instead of Bounce Rate — What “Engagement” Actually Means
If you used Universal Analytics, you’re used to looking for a bounce rate figure. GA4 doesn’t show it by default in its standard reports. Instead, the system shows engagement rate — and this isn’t a cosmetic rename, it’s a change in the underlying logic.
A session counts as engaged if at least one of three conditions is met: the user spent 10 or more seconds of active time on the site, viewed 2 or more pages/screens, or triggered at least one conversion event. It’s calculated with the formula engagement rate = engaged sessions ÷ total sessions × 100%. Out of 100 sessions, if 65 met at least one of these conditions, the engagement rate is 65%.
Why is this more honest for a business owner? Imagine a visitor who lands on a pricing page, reads it for 40 seconds, and calls you directly without visiting any other page. Under Universal Analytics’ logic, this counted as a “bounce” — one page meant “not interested.” In GA4, that same session counts as engaged, simply based on time spent.
In practice: an engagement rate below 30–40% on a page that paid ads point to is a reason to check whether the page content matches the promise made in the ad. Above 60% on a landing page is a sign that content and traffic are well aligned.
But the metric has its limits. It’s calculated at the level of the whole session, not an individual page — so it’s not the right tool for evaluating a single article in isolation from the rest of the site; average engagement time by page is better suited for that. There’s also a misleading version of high engagement: a visitor was looking for a phone number, landed on the homepage, went to the contact page, and closed the tab. Technically, that’s an engaged session (2 page views); in substance, the person just quickly found what they needed and didn’t explore the site further. We regularly see exactly this pattern with service-based clients whose sites have only a handful of pages — the owner is happy about a high engagement rate without noticing there are no conversions behind it. That’s why engagement rate should be read together with conversions: high engagement with no conversions and low engagement with good conversions are two different problems with two different solutions.
The 10-second threshold is configured at the Data Streams level and is the same for all sessions. It’s rarely worth changing — except perhaps for a site with a lot of short but complete visits (a page with a schedule or a phone number), where 10 seconds might be an inflated bar. For most small and mid-sized business sites, the standard threshold reflects real behavior well enough.
Conversions (Key Events) — Is the Site Actually Bringing in Leads?
This is where business owners most often draw the wrong conclusion that “the site isn’t working,” when the problem is technical rather than about actual results.
Contrary to what some owners expect, GA4 does not detect conversions automatically. The system doesn’t “know” that for your business, a conversion is a submitted form, a phone call, or a purchase. Every such event has to be manually marked as a Key Event in the property’s admin settings.
So if you see 0 conversions in a report while leads are actually coming in by mail or phone — that almost always means the event simply hasn’t been technically marked as a key event, not that the site isn’t generating leads.
You’ll find this report under Reports → Engagement → Conversions (labeled Key Events in some interface versions). It’s worth looking not just at the total count, but at how conversions relate to traffic source: go into Traffic acquisition and add the “Key events” column to see which channel actually brings in leads, not just visitors.
For example (illustrative numbers):
| Key event | Count this week | Main source |
| form_submit | 34 | Organic Search (16), Paid Search (12), Direct (6) |
| phone_click | 21 | Direct (9), Paid Search (8), Organic Search (4) |
| purchase | 5 | Organic Search (3), Paid Search (2) |
Here, phone calls (phone_click) come mostly from Direct — which, given the traps section above, is a reason to check your UTM tags rather than celebrate “organic” phone calls.
For online store owners, the logic goes further — monetization (revenue, average order value) is layered on top of conversions. More on that in our article on GA4 for e-commerce.
If you’re not yet sure every meaningful customer action is being captured as a conversion, it’s worth looking at the intermediate steps before the main lead form too: viewing a pricing page, adding a product to the cart, starting to fill out a form. We cover that in our article on micro-conversions.
If you want to make sure your reports are being read correctly and your conversions are set up properly — rather than just “seeming to work” — that’s the moment to order an analytics audit. It often turns out that some leads aren’t even making it into the report because of a technical setup error.
One detail worth knowing: an event is treated as a key event at the level of the entire GA4 property, not a single report. If you’ve marked “form_submit” as a key event, it will be counted toward conversions in any report that has that column — in Acquisition just as much as in Engagement. So setting up key events correctly once immediately improves the quality of every conclusion drawn afterward.
A common beginner mistake is marking an overly generic action, like “page_view” on any page, as a key event. That inflates the conversion count artificially, with numbers that don’t actually say anything about business results. A key event should be something that genuinely corresponds to money or a lead: a submitted inquiry form, a click on a phone number, a completed purchase.
Common Traps When Reading GA4 Reports
Before drawing conclusions from GA4 numbers, there are a few things worth knowing that regularly trip up business owners.
Unassigned and Direct traffic aren’t always “direct visits.” The “Direct / None” category doesn’t only mean visitors who manually typed in your site’s address. It also catches all traffic GA4 couldn’t determine a source for: visits from apps, links without UTM parameters, some types of “dark” links from messaging apps. A large share of “Direct” is almost always a signal to check UTM parameters on ad links and newsletters — not proof that people are genuinely arriving by typing your URL directly.
GA4’s numbers and reality diverge — and within limits, that’s normal. Because of cookie banners (consent mode), ad blockers, and browser restrictions, some visitors physically never make it into GA4. According to industry estimates from 2026, the typical discrepancy from these factors is roughly 10–30%, depending on how many visitors decline cookie consent and how popular ad blockers are among your audience. A gap of 10–20% versus your CRM or order system is the expected measurement error. Above 30% usually points to a technical configuration issue rather than natural data loss.
Don’t compare directly against old Universal Analytics. If you still have data from UA (sunset in July 2023), don’t try to reconcile numbers “session for session” — GA4 counts sessions using different logic. Notably, a GA4 session doesn’t reset at midnight and isn’t interrupted when the traffic source changes mid-visit — unlike UA, where both of those events forced a new session to start. Because of this, the total session count for the same period will almost always differ, and that’s not a migration error.
Google Signals and consent-mode changes keep affecting the numbers. Throughout 2026, Google has been progressively changing how data is reconciled between GA4 and Google Ads: control over passing along ad-related data is gradually shifting from the general Google Signals setting to a separate consent signal for advertising cookies (ad_storage). If the share of traffic marked as tied to ad campaigns changes significantly for no obvious reason, check your site’s consent settings or cookie banner first — before concluding that a campaign has failed. If data privacy and GDPR concern you at the level of choosing the analytics tool itself, rather than just its settings, it’s worth reading about GDPR-focused alternatives to GA4.
Don’t draw conclusions from a single day or week. Traffic and conversions fluctuate naturally — weekends, holidays, seasonality within your niche. Compare periods of equal length and pay attention to a sustained trend rather than a one-off deviation.
What to Check Weekly as a Business Owner
You don’t need to go into Explore every day and build custom reports. It’s enough to check five things once a week in the standard Reports section:
| # | What to check | Where to find it | What a change means |
| 1 | Sessions by channel (Traffic acquisition) | Reports → Acquisition | A sharp drop in one channel — a signal to check the ad platform or look for a technical issue |
| 2 | Engagement rate by channel | Reports → Acquisition (add column) | A drop below 30–40% on paid campaigns — a mismatch between the ad and the landing page |
| 3 | Conversions (Key events) by source | Reports → Engagement → Conversions | A channel with high traffic but low conversion — wasted budget |
| 4 | Share of Direct/Unassigned traffic | Reports → Acquisition | A growing share — check UTM parameters on links and newsletters |
| 5 | Revenue or conversion value (if monetization is set up) | Reports → Monetization | The basis for calculating marketing ROI |
This checklist doesn’t replace a deep analytical review, but it lets a business owner spend 10 minutes a week noticing that something’s off before it affects sales.
The easiest way to not forget this check is to tie it to a specific day and time — Monday morning before planning the week, for instance. If none of the five numbers has changed significantly compared to the previous week, everything’s fine, and it’s not worth spending more than a few minutes on it. If you do notice a sharp deviation, that’s when it makes sense to dig into the details: specific campaigns, pages, or days when the change happened.
GA4 won’t tell you outright whether your business is doing well. But it will show you where people are coming from and what they do next — and that’s already half the answer. The five reports in this guide — Acquisition, Engagement, Conversions, common traps, and the weekly checklist — give you enough to track the state of your business online on your own, without diving deep into technical setup.
But self-interpretation has its limits. When you need to figure out whether key events are set up correctly, why a high-traffic channel isn’t converting, or how to build reporting around your specific business goals — that’s where interpreting things yourself easily leads to wrong conclusions and wasted budget. If you want to understand what’s actually happening with your traffic, and whether budget is leaking somewhere you can’t see, order an analytics audit, and we’ll show you the full picture instead of isolated numbers.