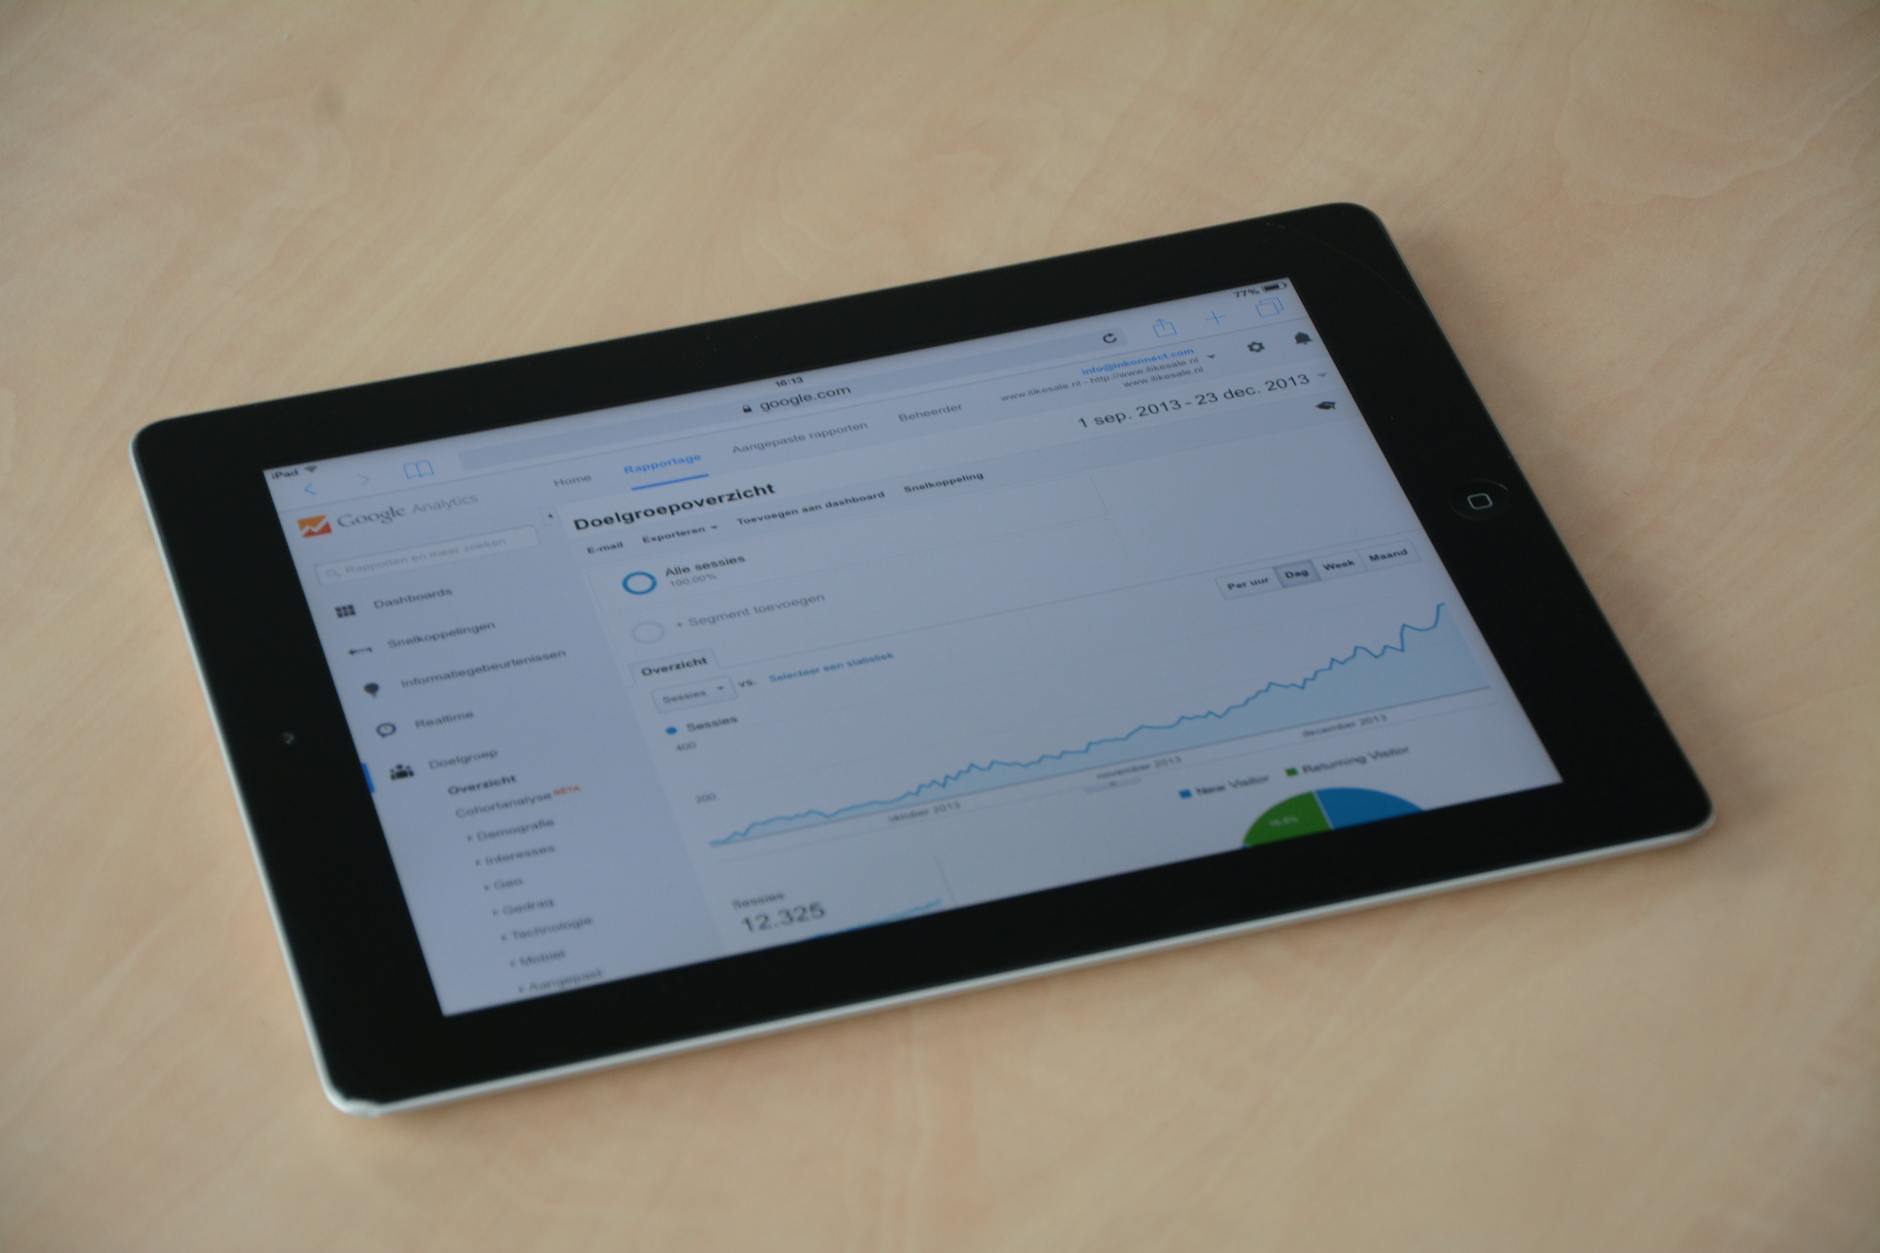
Why you should focus on micro-conversions before optimizing your main goal. Scroll depth, clicks, time on page, GA4 events, and how to get the most from them.
Most businesses track one metric — the main conversion. A purchase, form submission, or registration. But what happens before that? Hundreds of visitors arrive, browse your pages, and leave. Without data on their behavior, you don’t know where or why you’re losing them.
Micro-conversions are smaller actions that signal interest and move users closer to your main goal. Tracking and optimizing them is the key to dramatically improving your entire website‘s performance — often at minimal cost.
What Are Micro-Conversions and Why They Matter
Micro-conversions are measurable actions that show a visitor has expressed interest but hasn’t yet completed the main goal. They’re stepping stones on the path to a macro-conversion (purchase, order, registration).
Examples of micro-conversions: adding a product to cart, clicking on pricing or a “Learn more” button, playing a product video, scrolling to 75% of the page, spending more than 60 seconds on a key page, subscribing to a newsletter, and downloading a PDF resource.
The Conversion Hierarchy — From First Click to Purchase
Think of the customer journey as a funnel. Each level represents a smaller group of people who have shown stronger interest.
Level 1 — engagement: pageviews, scroll depth, time on page. Level 2 — interest: product clicks, pricing page views, video plays. Level 3 — intent: add to cart, form fills, checkout initiated. Level 4 — conversion: purchase, order submitted, contract signed.
Optimizing the lower levels first (intent, interest) makes sense — incremental improvement at Level 3 directly impacts Level 4.
Key Micro-Conversions and How to Measure Them in GA4
Scroll Depth — How Far They Read
GA4 automatically measures scroll to 90% of the page as an enhanced measurement event. But that’s not enough. Set up custom events for 25%, 50%, and 75%. You’ll discover where on the page users “drop off” and stop reading.
If 70% of users scroll to 50% but only 20% reach 75%, you have a problem in the second half of the page. Maybe the content is too long, a visual break is missing, or the key call to action is placed too low.
Time Spent on Page
GA4 measures engagement time — the time when the page is in the foreground and the user is active. This is more accurate than the old Google Analytics “session duration.” Monitor average engagement time on key pages.
For services and B2B websites, time on page is a critical indicator. If average time on a service page drops below 30 seconds, the content probably doesn’t answer the visitor’s questions or is poorly structured.
CTA Button Clicks
Track clicks on key buttons — “Order,” “Get a Quote,” “Add to Cart,” “View Pricing.” In GA4, set up custom events for each important button. Compare button CTR across different pages and positions.
If your “Book a Consultation” button in the hero section has a 2.5% CTR and the same button at the bottom of the page has 0.3%, you know users decide quickly and the bottom CTA needs more compelling context.
Key Page Views
Pages like pricing, contact, about us, and case studies signal strong interest. Measure the proportion of visitors who reach these pages from the landing page. A low ratio means your navigation or landing page content isn’t persuasive enough.
Video Plays
Video engagement is a strong interest signal. Measure: play start, 25%, 50%, 75%, and 100% completion. GA4 has native support for YouTube embeds. For custom video players, use custom events.
How to Set Up Micro-Conversion Tracking
In Google Analytics 4, you have two options: enhanced measurement (automatic tracking of basic interactions) and custom events via Google Tag Manager (GTM).
Enhanced measurement captures: page_view, scroll (90%), click (outbound links), video_start/progress/complete (YouTube), file_download. That’s a good foundation, but for advanced optimization, you need custom events.
From Data to Action — How to Optimize
Data without action is useless. Here’s a framework for turning micro-conversions into real improvements.
Step 1: Identify the Biggest Drop-Off
Look at the funnel. Where are you losing the most people? If 60% of product page visitors scroll past the pricing section but only 5% click “Order,” the problem is in the transition from interest to action. Maybe social proof is missing, the price isn’t clear, or the CTA button isn’t prominent enough.
Step 2: Formulate a Hypothesis
Based on the data, create a specific hypothesis. Not “the page doesn’t work,” but “adding customer reviews above the CTA button will increase CTR from 5% to 8%, because data shows users scroll past the CTA without clicking.”
Step 3: Test and Measure
Implement the change and track its impact on micro-conversions. If you don’t have enough traffic for an A/B test, use a before/after comparison with at least a 2-week window for each variant.
Micro-Conversions in Ad Campaigns
Micro-conversions aren’t just for web analytics. They have direct applications in ad platforms — Google Ads and Meta Ads both allow optimization toward micro-conversions when you don’t have enough main conversions.
Google Ads needs at least 30–50 conversions per month for effective smart bidding. If you only have 10 purchases per month, you can’t effectively optimize for purchases. Solution: optimize for a micro-conversion (add to cart, begin checkout) and gradually switch to the main conversion as data volume grows.
The same logic applies to Meta Ads — the algorithm needs at least 50 conversions per week at the ad set level. If you can’t reach that, move the goal higher in the funnel to a micro-conversion close to purchase.
Practical Examples by Business Type
E-Commerce
Key micro-conversions: product views, add to cart, begin checkout. Track the cart-to-purchase rate — if it’s below 30%, your checkout process needs optimization.
SaaS / Services
Key micro-conversions: pricing page views, “Try for free” clicks, first form step completion. Track form abandonment rate — if more than 60% of people leave after the first step, the form is too complex or asks for too much personal information.
Lead Generation
Key micro-conversions: scroll to contact form, phone number clicks, PDF downloads, “About Us” page views. Track the ratio of key page visitors to submitted forms.
Tools for Advanced Measurement
The foundation is GA4 + GTM. For deeper analysis, consider supplementary tools: heatmaps and session recordings (Hotjar, Microsoft Clarity — both have free plans), A/B testing platforms (VWO, AB Tasty), and funnel analysis (GA4 Exploration reports, Mixpanel).
Microsoft Clarity is free and offers heatmaps, session recordings, and rage click detection. As a starting point, it’s an ideal complement to GA4.
- Micro-conversions occur for 10–30% of visitors vs. 1–3% for main conversions — more data = faster optimization
- Key micro-conversions: scroll depth, time on page, CTA clicks, pricing page views, video engagement
- GA4 + GTM provide everything needed for tracking — enhanced measurement + custom events
- Identify the biggest funnel drop-off and formulate specific hypotheses
- Ad platforms allow optimization toward micro-conversions when main conversion volume is insufficient
- Microsoft Clarity (free) complements GA4 with heatmaps and session recordings
- Always verify that micro-conversion improvements translate to main conversion gains